AnyBoard enables you to use AppleTV as monitoring center. By creating various dashboards you can display your data in a new way and keep it always in your sight.
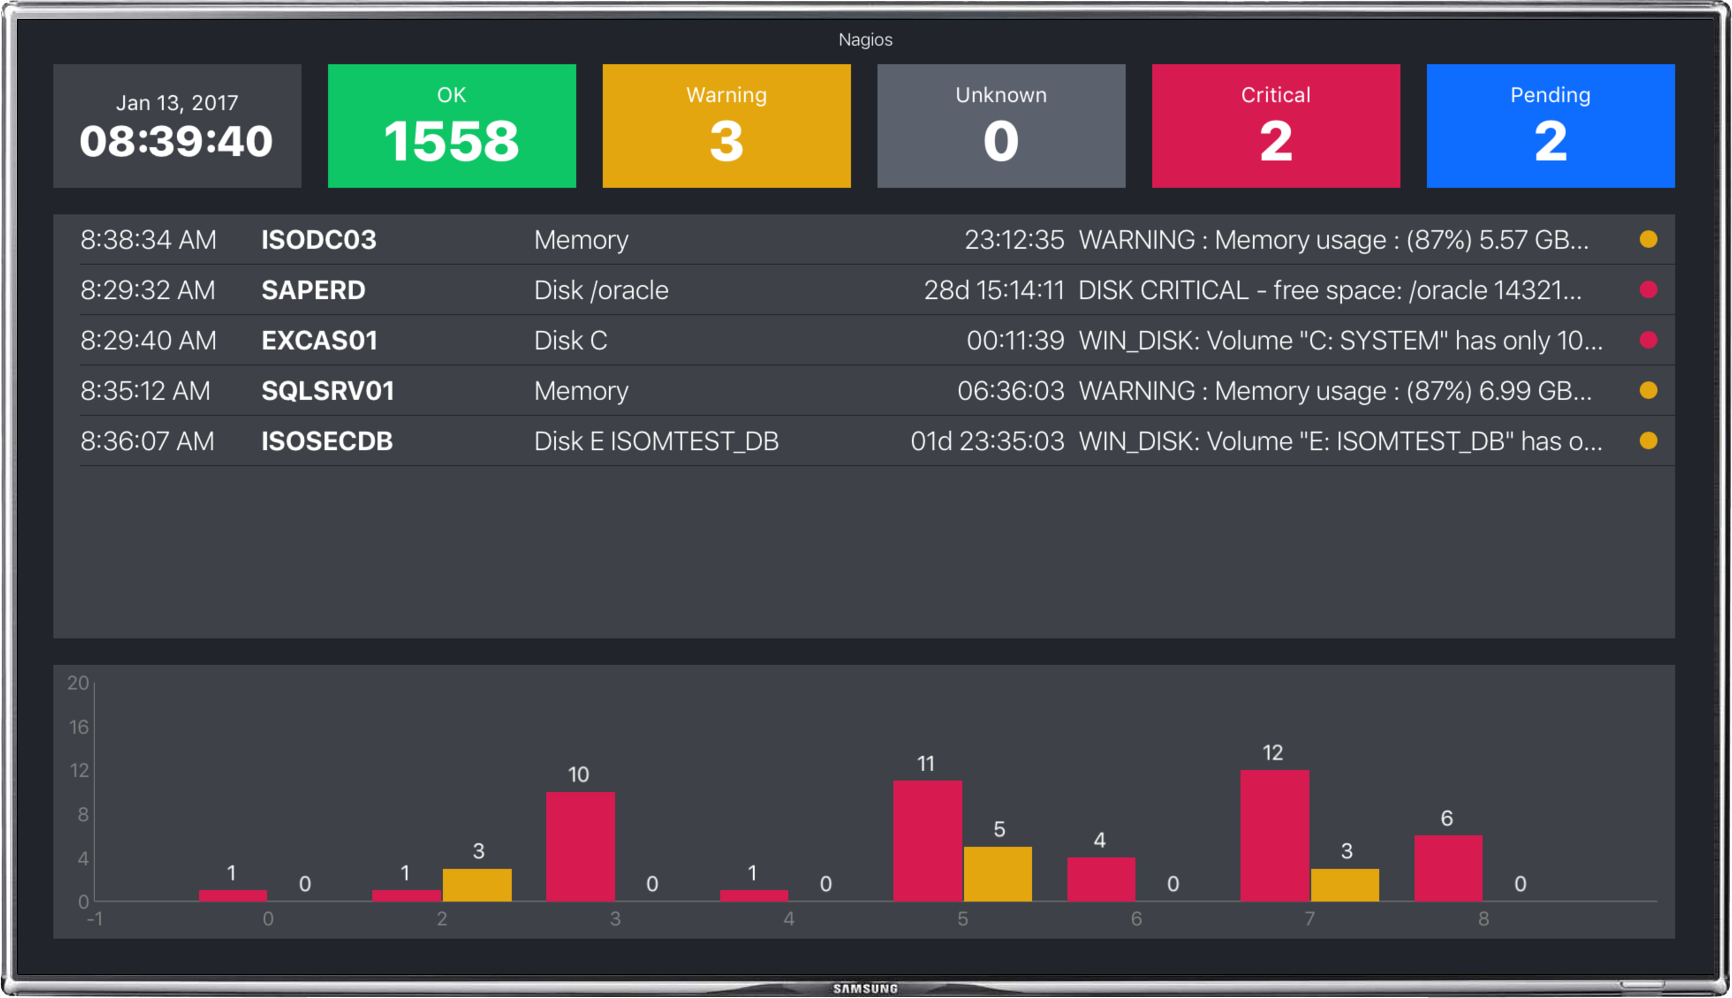
Prebuilt Nagios dashboard displays service status totals, service status details and criticals and warnings occurrences in last hours. Not enough? Inspire us to add more Nagios features.
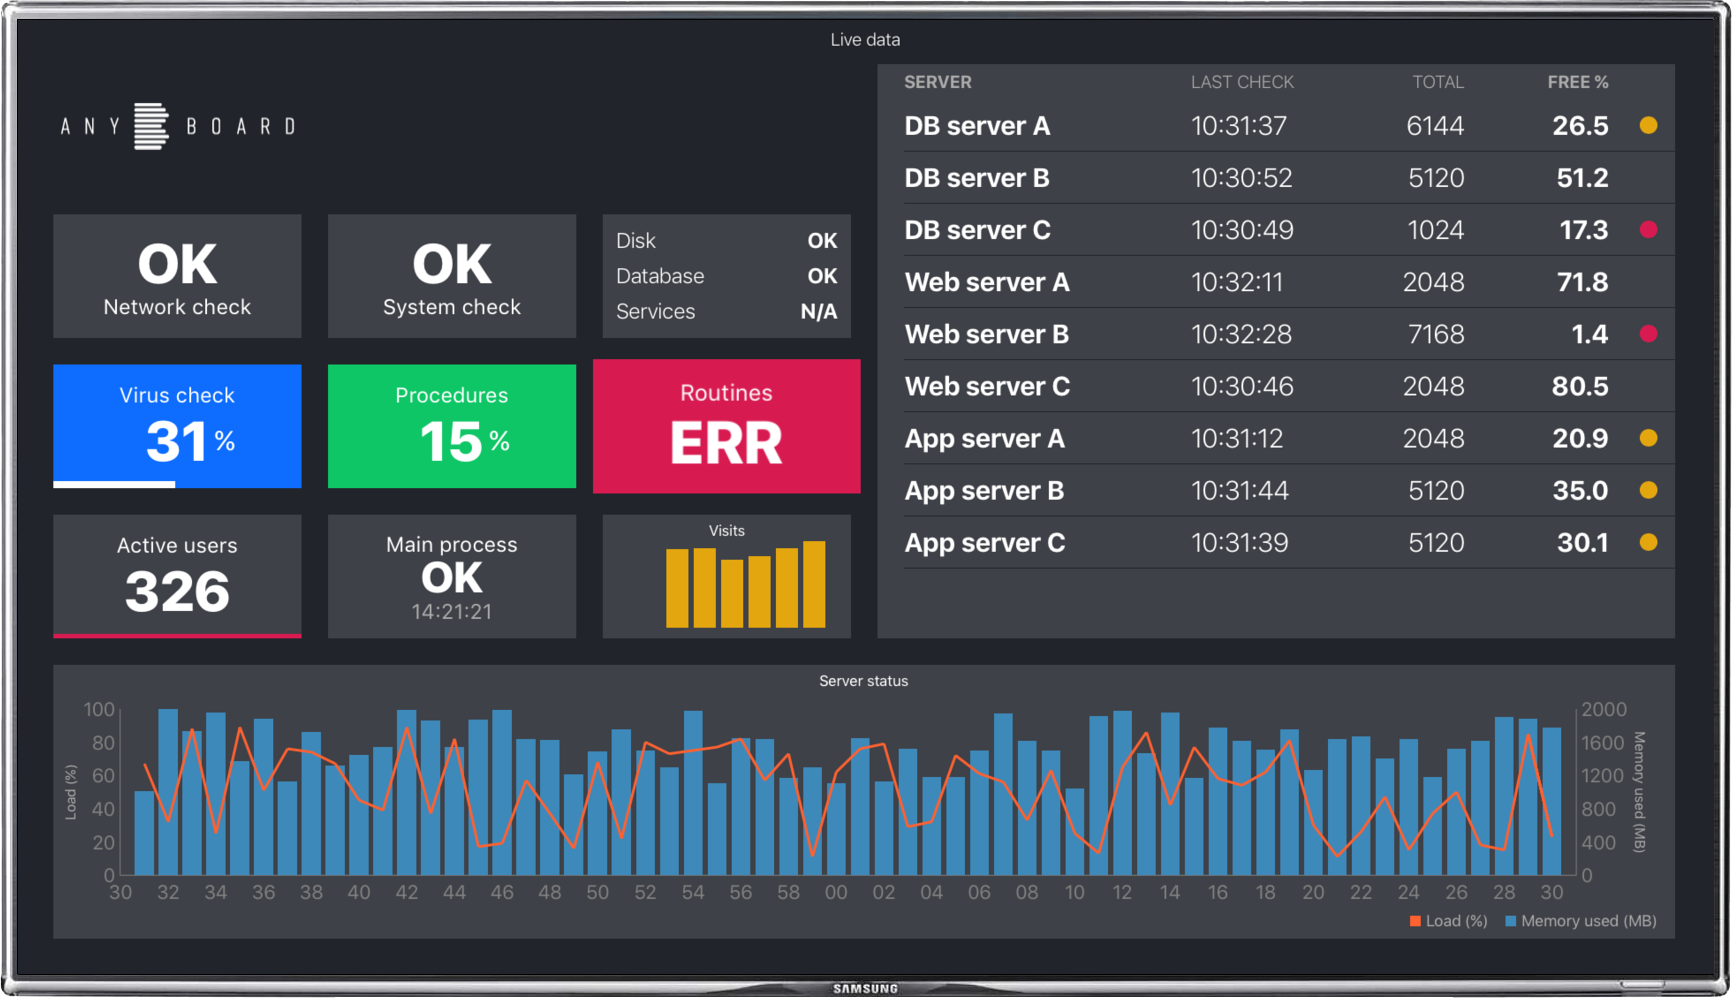
Configure your own dashboard using simple widgets. Combine tables, charts and value tiles with your data to create custom overviews. Get notified on critical change, show right dashboard at the right time.
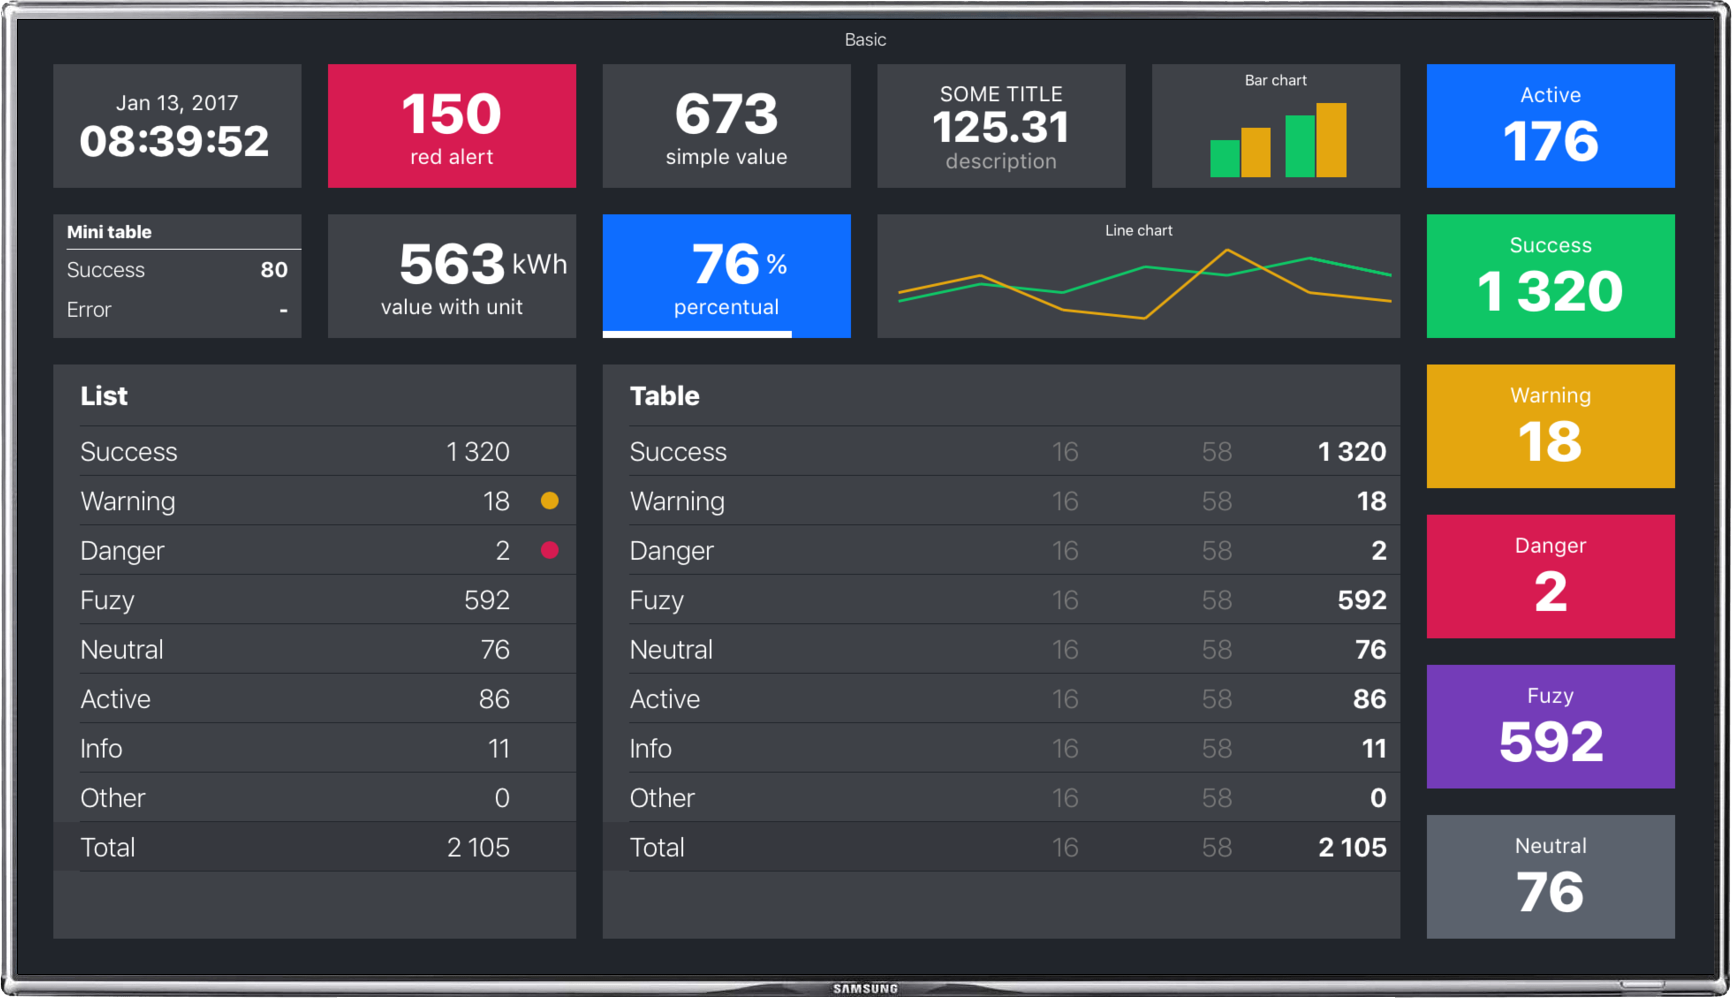
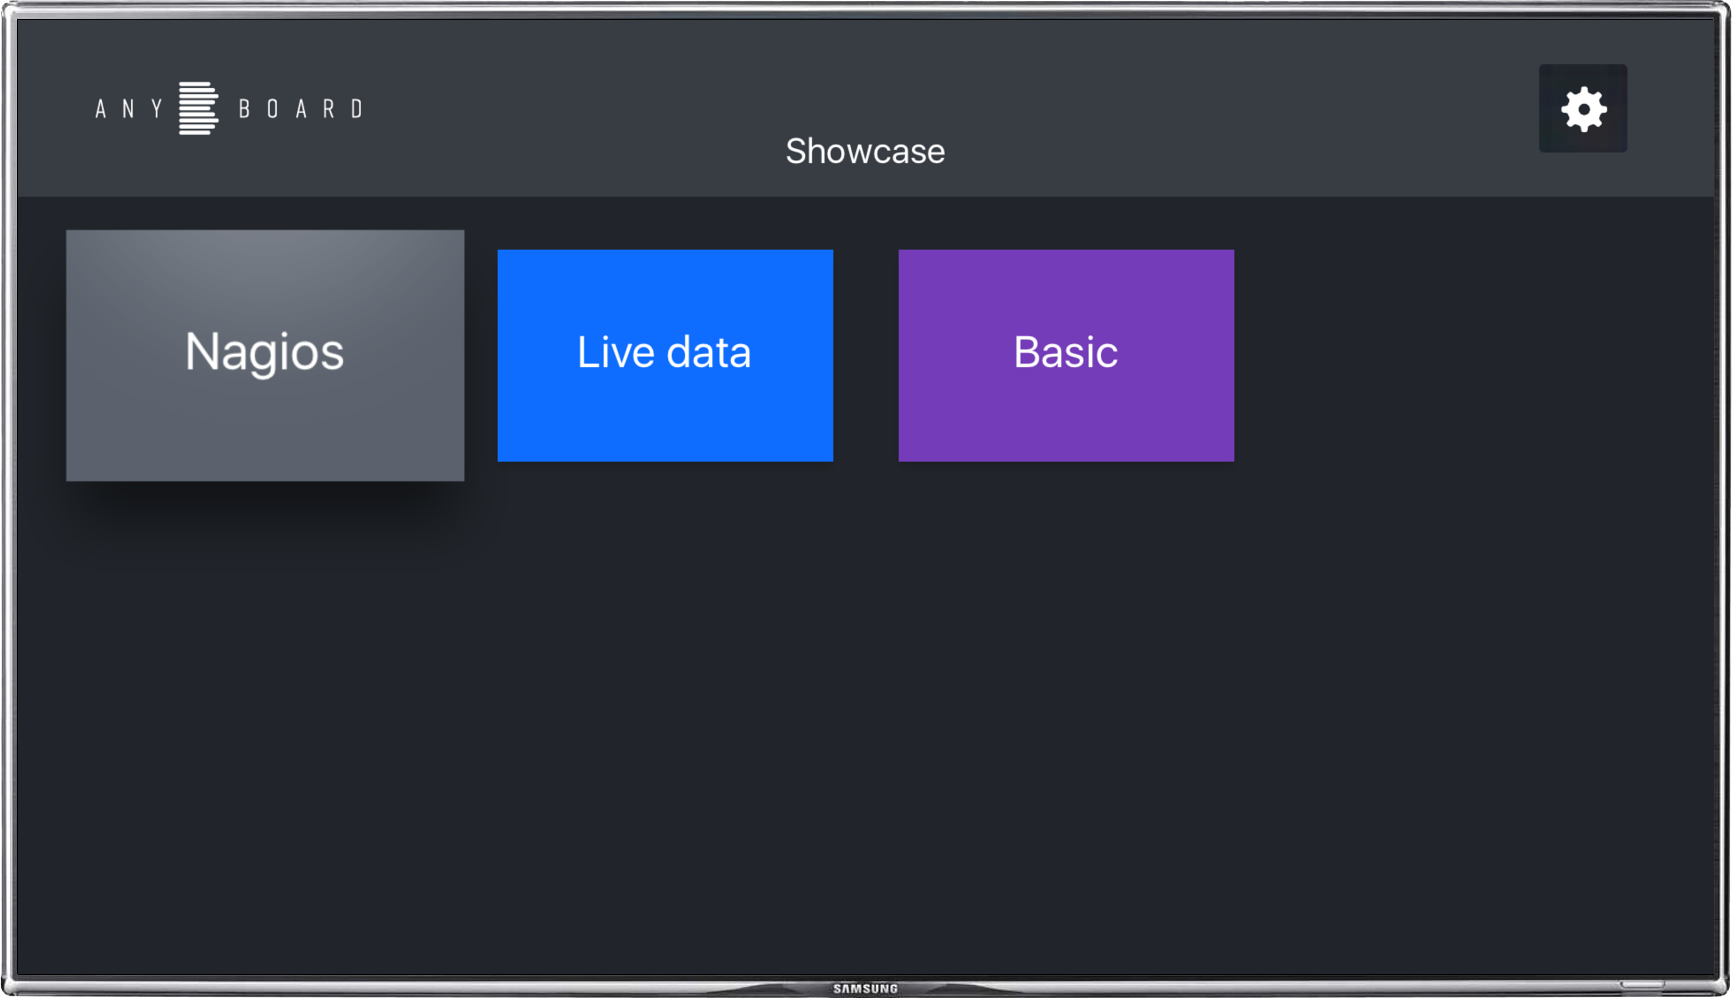
Example is default configuration in AppleTV app. It contains two dashboards. Basic dashboard contains variuos widgets to demonstrate options for custom dashboards. It has static data. Live data dashboard loads data from two sources. First has response customized for AnyBoard, so widgets do not need to declare data mapping. Second data source has general format.
JSON Schema describes all options for dashboards configuration. You can validate your configuration against JSON schema here.